<!doctype html>
<html>
<head>
<title>Tooltip Interaction Modes</title>
<!-- <script src="../../dist/chart.min.js"></script> -->
<script src="https://cdnjs.cloudflare.com/ajax/libs/Chart.js/2.9.3/Chart.js" integrity="sha512-QEiC894KVkN9Tsoi6+mKf8HaCLJvyA6QIRzY5KrfINXYuP9NxdIkRQhGq3BZi0J4I7V5SidGM3XUQ5wFiMDuWg==" crossorigin="anonymous"></script>
<!-- <script src="../../utils.js"></script> -->
<style>
canvas {
-moz-user-select: none;
-webkit-user-select: none;
-ms-user-select: none;
}
.chart-container {
width: 400px;
margin-left: 10px;
margin-right: 10px;
margin-bottom: 10px;
border : 1px solid black;
}
.container {
display: flex;
flex-direction: row;
flex-wrap: wrap;
justify-content: center;
}
</style>
</head>
<body>
<div class="container"> </div>
<script>
var charts = [];
// 차트 생성하기
function createConfig(mode, intersect) {
return {
// 차트 타입
type: 'line',
// 데이터셋
data: {
labels: ['January', 'February', 'March', 'April', 'May', 'June', 'July'],
datasets: [{
label: 'My First dataset',
borderColor: window.chartColors.red,
backgroundColor: window.chartColors.red,
data: [10, 30, 46, 2, 8, 50, 0],
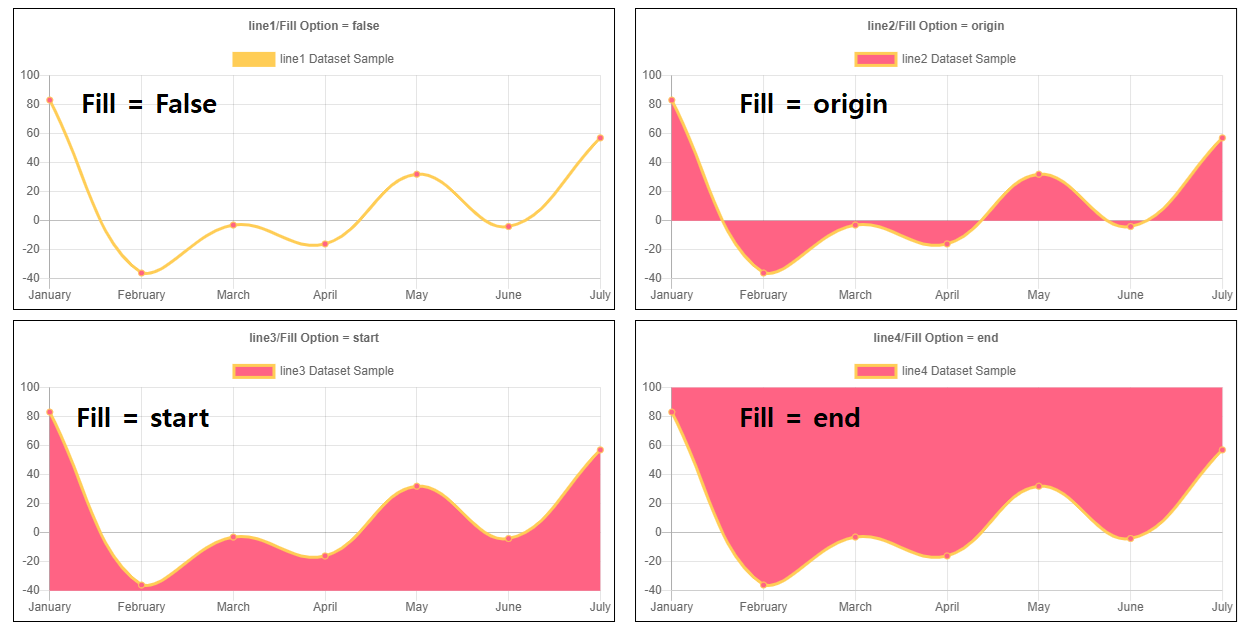
fill: false,
}, {
label: 'My Second dataset',
borderColor: window.chartColors.blue,
backgroundColor: window.chartColors.blue,
data: [7, 49, 46, 13, 25, 30, 22],
fill: false,
}]
},
// 옵션
options: {
responsive: true,
title: {
display: true,
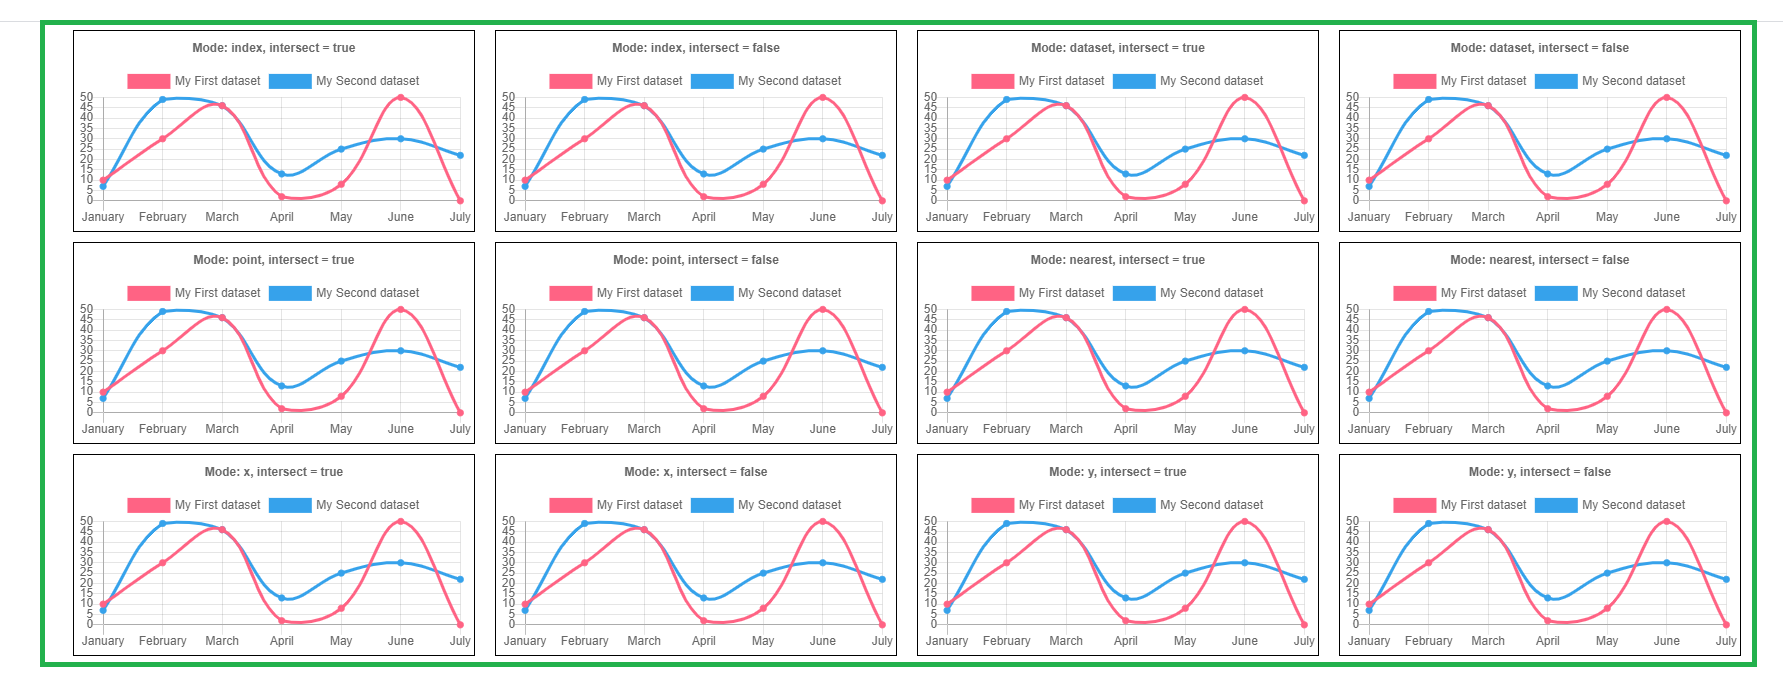
text: 'Mode: ' + mode + ', intersect = ' + intersect
},
tooltips: {
mode: mode,
intersect: intersect,
},
hover: {
mode: mode,
intersect: intersect
},
}
};
}
window.onload = function () {
var container = document.querySelector('.container');
// mode : defalut 'nearest' (툴팁에 표시되는 요소를 설정)
// intersect : defalut true || false (마우스 위치가 차트의 항목과 교차할 때 만 호보)
// axis :
// animationDuration : 호버 스타일 변경을 애니메이션하는 데 걸리는 시간 (밀리 초)
[{
mode: 'index',
intersect: true,
animationDuration: 100
}, {
mode: 'index',
intersect: false,
animationDuration: 300
}, {
mode: 'dataset',
intersect: true,
animationDuration: 100
}, {
mode: 'dataset',
intersect: false,
animationDuration: 300
}, {
mode: 'point',
intersect: true,
animationDuration: 100
}, {
mode: 'point',
intersect: false,
animationDuration: 300
}, {
mode: 'nearest',
intersect: true,
animationDuration: 100
}, {
mode: 'nearest',
intersect: false,
animationDuration: 300
}, {
mode: 'x',
intersect: true,
animationDuration: 100
}, {
mode: 'x',
intersect: false,
animationDuration: 300
}, {
mode: 'y',
intersect: true,
animationDuration: 100
}, {
mode: 'y',
intersect: false,
animationDuration: 300
}].forEach(function (details) {
console.log('details', details);
// div 생성. <div class='chart-container'> </div>
var div = document.createElement('div');
div.classList.add('chart-container');
// canvas 생성.
var canvas = document.createElement('canvas');
div.appendChild(canvas);
container.appendChild(div);
// 2d 렌더링 컨텍스트를 나타내는 CanvasRenderingContext2D 객체를 생성하게 합니다.
var ctx = canvas.getContext('2d');
var config = createConfig(details.mode, details.intersect);
charts.push(new Chart(ctx, config));
});
};
</script>
<script>
// charts.js에서 제공하는 utils.js
'use strict';
window.chartColors = {
red: 'rgb(255, 99, 132)',
orange: 'rgb(255, 159, 64)',
yellow: 'rgb(255, 205, 86)',
green: 'rgb(75, 192, 192)',
blue: 'rgb(54, 162, 235)',
purple: 'rgb(153, 102, 255)',
grey: 'rgb(201, 203, 207)'
};
(function(global) {
var MONTHS = [
'January',
'February',
'March',
'April',
'May',
'June',
'July',
'August',
'September',
'October',
'November',
'December'
];
var COLORS = [
'#4dc9f6',
'#f67019',
'#f53794',
'#537bc4',
'#acc236',
'#166a8f',
'#00a950',
'#58595b',
'#8549ba'
];
var Samples = global.Samples || (global.Samples = {});
var Color = Chart.helpers.color;
function applyDefaultNumbers(config) {
var cfg = config || {};
cfg.min = cfg.min || 0;
cfg.max = cfg.max || 1;
cfg.from = cfg.from || [];
cfg.count = cfg.count || 8;
cfg.decimals = cfg.decimals || 8;
cfg.continuity = cfg.continuity || 1;
return cfg;
}
Samples.utils = {
// Adapted from http://indiegamr.com/generate-repeatable-random-numbers-in-js/
srand: function(seed) {
this._seed = seed;
},
rand: function(min, max) {
var seed = this._seed;
min = min === undefined ? 0 : min;
max = max === undefined ? 1 : max;
this._seed = (seed * 9301 + 49297) % 233280;
return min + (this._seed / 233280) * (max - min);
},
numbers: function(config) {
var cfg = applyDefaultNumbers(config);
var dfactor = Math.pow(10, cfg.decimals) || 0;
var data = [];
var i, value;
for (i = 0; i < cfg.count; ++i) {
value = (cfg.from[i] || 0) + this.rand(cfg.min, cfg.max);
if (this.rand() <= cfg.continuity) {
data.push(Math.round(dfactor * value) / dfactor);
} else {
data.push(null);
}
}
return data;
},
labels: function(config) {
var cfg = config || {};
var min = cfg.min || 0;
var max = cfg.max || 100;
var count = cfg.count || 8;
var step = (max - min) / count;
var decimals = cfg.decimals || 8;
var dfactor = Math.pow(10, decimals) || 0;
var prefix = cfg.prefix || '';
var values = [];
var i;
for (i = min; i < max; i += step) {
values.push(prefix + Math.round(dfactor * i) / dfactor);
}
return values;
},
months: function(config) {
var cfg = config || {};
var count = cfg.count || 12;
var section = cfg.section;
var values = [];
var i, value;
for (i = 0; i < count; ++i) {
value = MONTHS[Math.ceil(i) % 12];
values.push(value.substring(0, section));
}
return values;
},
color: function(index) {
return COLORS[index % COLORS.length];
},
transparentize: function(color, opacity) {
var alpha = opacity === undefined ? 0.5 : 1 - opacity;
return Color(color).alpha(alpha).rgbString();
}
};
// DEPRECATED
window.randomScalingFactor = function() {
return Math.round(Samples.utils.rand(-100, 100));
};
// INITIALIZATION
Samples.utils.srand(Date.now());
// Google Analytics
/* eslint-disable */
if (document.location.hostname.match(/^(www\.)?chartjs\.org$/)) {
(function(i,s,o,g,r,a,m){i['GoogleAnalyticsObject']=r;i[r]=i[r]||function(){
(i[r].q=i[r].q||[]).push(arguments)},i[r].l=1*new Date();a=s.createElement(o),
m=s.getElementsByTagName(o)[0];a.async=1;a.src=g;m.parentNode.insertBefore(a,m)
})(window,document,'script','//www.google-analytics.com/analytics.js','ga');
ga('create', 'UA-28909194-3', 'auto');
ga('send', 'pageview');
}
/* eslint-enable */
}(this));
</script>
</body>
</html>